

 Facebook
 X
X
 Pinterest
 Copy Link

When people talk about the “best” time to buy or sell a home, I think what we’re often really asking is something more personal. When is my home most likely to sell? When might I get the most money for it? When will I have the best chance of finding a home to buy?
Those questions often lead us to talk about the seasons. In practice, spring and summer are usually busier and more competitive, while fall and winter are often calmer, with fewer homes and fewer buyers in the mix. Those patterns are real, and they show up clearly in the data. But what happens if you need to buy or sell in the winter? Is it actually a bad time, or just different?
The charts below take a closer look at the seasonal trends the market tends to follow year after year. The first chart compares how many homes were active or contingent at the end of each month with how many sales closed during that same month. It’s a helpful way to see the overall rhythm of the market, but it’s only one piece of the picture. To round things out, I’ve included three additional charts that look at other key data points, and I’ll walk you through each one so you can better understand what they all mean if you’re thinking about buying or selling a home.
Number of Homes for Sale vs Sold
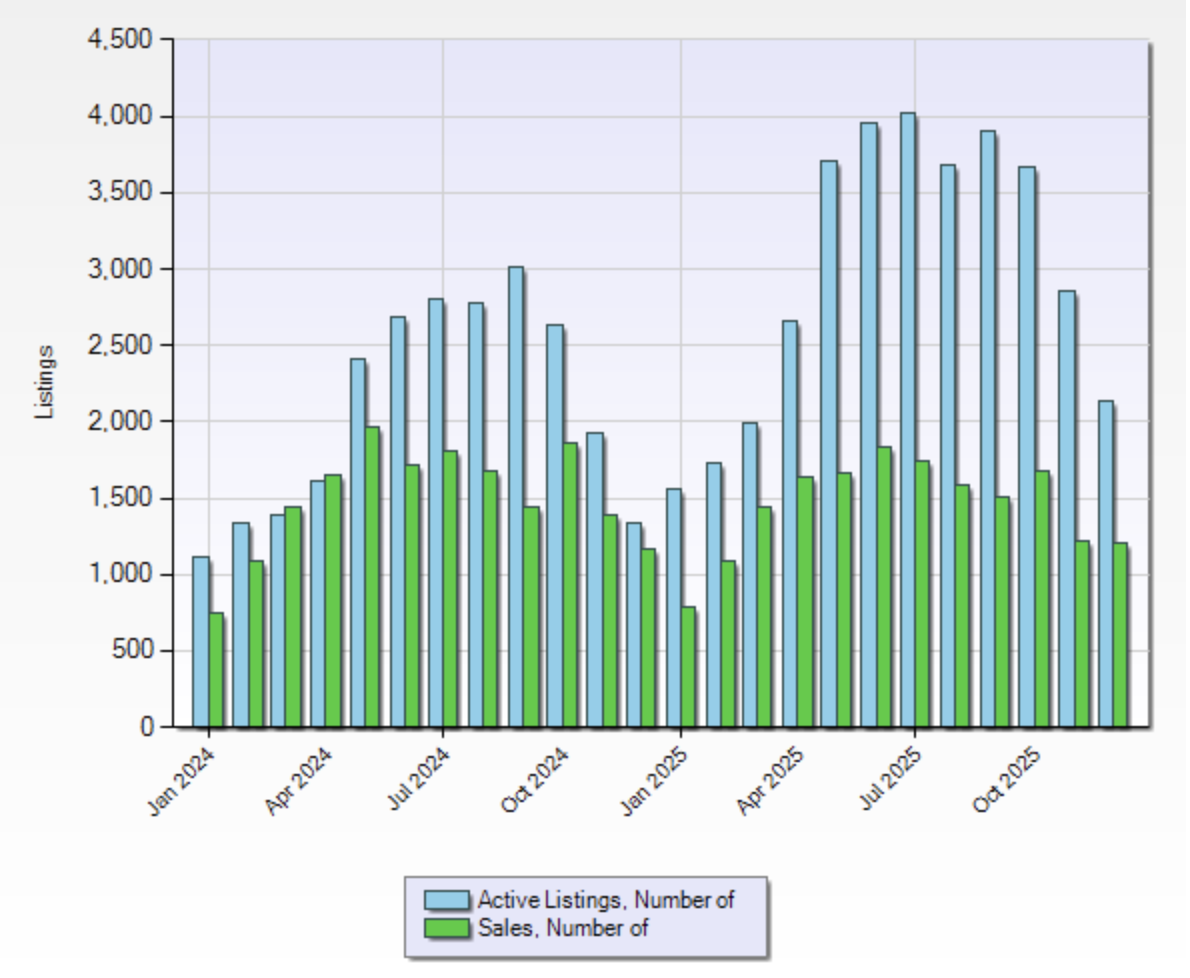
When you look at the data from January 2024 through December 2025, a clear seasonal pattern starts to take shape. In both years, the number of homes available for sale grew as we moved into spring, and the number of closed sales rose right along with it. Simply put, more homes were coming on the market and more homes were selling.
As we moved into late fall and winter, both of those numbers eased back. Fewer homes were listed for sale, and fewer transactions took place overall.
This lines up with what many homeowners and buyers experience in real life. Spring and summer tend to bring more “For Sale” signs and more “Sold” signs, while the pace naturally slows as the year winds down.
New Listings Per Month

This chart shows how many homes came on the market each month over the past two years.
New listings begin to increase early in the year, continue building through spring, and reach their highest levels in late spring and early summer.
As the year moves on, fewer new homes are listed. Activity gradually tapers off through the fall, followed by a more noticeable slowdown during the winter months. Toward the end of each year, listing activity reaches its low point before beginning to rise again in the new year.
Average Days to Sell

This chart shows the average number of days it took for a home to go from “Just Listed” to Sold.
In both 2024 and 2025, homes sold fastest in the spring and early summer, with average days to sell falling in the mid-teens to low-20s. In late fall and winter, homes generally stayed on the market longer, with average days to sell rising into the 30s and 40s, particularly in December and January.
It’s important to remember that these figures reflect averages across King County as a whole and across all property types. Some homes sold much faster than the average, while others took longer, even within the same season. Spring does not guarantee a quick sale, and winter does not prevent one.
The key takeaway is that homes often find a buyer quickly in the spring and summer months. A similar home can still sell in December, but sellers should plan for a longer timeline.
Pricing Power: List‑to‑Sale Price Ratio

Another helpful data point looks at the relationship between a home’s list price and its final sale price.
For single family homes in King County, the spring months tended to land at or above 100 percent, meaning homes often sold for around their asking price or higher on average. As the year moved into late summer and fall, that ratio gradually eased, settling closer to or slightly below 100 percent, especially toward the end of the year.
When you look at this alongside the average days to sell, a familiar picture starts to form. Spring and summer generally bring a more competitive environment, with homes selling faster and closer to, or above, list price. In fall and winter, homes often take longer to sell and there is typically a bit more room for negotiation, even though well priced homes can still perform well.
What This Means if You’re Planning a Move
When you look at this data over time, these seasonal patterns tend to show up year after year. What changes is the scale. The size of the wave, the exact numbers, and the experience for any individual buyer or seller will always vary.
These charts aren’t meant to predict exact outcomes on specific dates. Instead, they help set expectations by showing how market activity tends to rise and fall throughout the year. With that context in mind, here’s how these seasonal shifts often play out for buyers and sellers.
Spring and Summer
- More new listings
- More total homes on the market
- More sales closing
- Shorter average days to sell
- Higher list‑to‑sale price ratios
For sellers, there are more buyers, which usually means more showings and interest building more quickly, which can sometimes lead to multiple offers.
The flip side is that more homes are also coming on the market. With increased competition from other listings, pricing and presentation still matter. Longer days and better weather can help, especially when it comes to showing off outdoor living spaces, landscaping, and natural light.
For buyers, spring and summer often offer the most choice. More homes on the market means more options and a better chance of finding the right fit. Increased daylight makes it easier to evaluate landscaping, exterior condition, and natural light, and to notice things that can be harder to see during darker winter months or when the ground is covered by snow.
The tradeoff is that the pace is usually faster and competition can be stronger. Buyers often need to be prepared to move quickly and write clean, thoughtful offers. In some cases, that may mean being flexible on closing timelines, offering above asking price if it fits your budget, or using an escalation clause when appropriate.
Fall and Winter
- Fewer new listings
- Fewer total homes on the market
- Fewer sales closing
- Longer average days to sell
- Slightly lower list‑to‑sale price ratios on average
For sellers, patience often becomes more important during this time of year since there are fewer buyers actively searching. Longer days on market can sometimes lead to price adjustments or the need for additional strategies to increase appeal, such as offering buyer incentives or adjusting buyer broker compensation to help offset buyer costs.
That said, listing during the fall and winter can offer some meaningful advantages. While there are fewer buyers overall, those who are actively looking tend to be more serious and ready to act. With fewer homes on the market, a well-prepared property has more opportunity to stand out. The colder months can also make it easier to highlight features that may fade into the background during the summer, such as a cozy fireplace, energy efficient heating, good insulation, or newer windows that help a home feel warm and comfortable.
For buyers, there are typically fewer homes to choose from, which can create a calmer pace and, in some cases, more room to negotiate. Sellers may be more open to conversations around price, closing timelines, or other terms, especially if a home has been on the market longer.
This time of year can also offer some practical advantages. Certain aspects of a home tend to be more apparent, including how the heating performs, the quality of insulation, drafty windows, or yard drainage.
So When should I buy or sell?
The bottom line is that the best time to buy or sell depends on your goals, your timeline, and how comfortable you feel with a busier market or a calmer one.
An important note about this data
The statistics in these graphs are based on MLS data for single family homes across King County as a whole. This provides a solid county wide picture of how the market tends to behave throughout the year. However, market conditions can look very different from one city to another, and even more so from one neighborhood to the next within the same city.
Some areas experience faster average days to sell, different seasonal peaks, and stronger or softer list to sale price patterns than the county wide averages suggest.
If you’d like to see an analysis like this focused on a specific neighborhood, type of home, or price range, feel free to reach out. I’m happy to put together a more localized breakdown so you’re looking at numbers that reflect the area you’re actually buying or selling in, not just the county wide big picture.
